

Full Paper

|
|
Full Paper |
|
Back to
List of papersAn Interactive Graphing Tool: The Meeting of Pedagogy and Technology
David M. Kennedy, Paul Fritze, Peter McTigue
d.kennedy@meu.unimelb.edu.au, p.fritze@meu.unimelb.edu.au, p.mctigue@meu.unimelb.edu.au
Multimedia Education Unit, The University of Melbourne
Abstract
The rapid growth of new technologies and World Wide Web (WWW) in particular have become more important for the delivery of academic courses in higher education. The WWW provides obvious logistical advantages including improved student access to courses both locally and at a distance, and providing on-line remediation or assessment. However, the problem remains for a interactive multimedia developer (IMM)-how to transform what is already known about good teaching practice in classrooms and tutorials into computer-facilitated learning (CFL) and the world of on-line courseware.
This paper reports the results of a study of the development and formative evaluation of an innovative element designed to be implemented in computer-facilitated learning (CFL). The CFL element is an interactive graphing tool (IGT) designed to be used in Web-based courses or hybrid Web/CD-ROM systems. The IGT permits students to sketch a graph on screen using the mouse and responds to a wide range of common graph types including logarithmic, exponentials, curves, and straight lines.. The IGT facilitates an iterative approach to developing student knowledge constructions of graphical representations of knowledge.
While the examples provided in this paper relate to reaction kinetics and chemical equilibrium in undergraduate chemistry, it must be stressed that the graphing tool is applicable to many other academic disciplines with similar needs to foster the development of student understanding of graphical representations of knowledge.
Introduction
There are two important issues affecting the application of new technologies which are crucial if there are to be any lasting improvements in student learning outcomes and the success of on-line courses. They are the:
Over the past few years two components for delivering courses via the WWW have emerged-the server-side applications (e.g., WebCT®, FirstClass®, TopClass® and cMILE®) and the client-side applications with which the learner interacts. While considerable efforts have been invested in developing course management software which functions from the server-side of course delivery to facilitate the linking of course content, Web pages, logging of student activity and reporting of student interactions only minimal (institutional or commercial) efforts have been made on developing pedagogically sound applications on the client or student-side. In the vernacular of information technology developers-course management software is server-side 'thick' but client-side 'thin'. However, there is a third dimension to course delivery-the role of content provider who is in most situations a lecturer appointed because of her or his content expertise rather than an ability to program a computer. There is a need for course designers to have available educational tools which engage students actively in learning and are simple to deploy. At the Multimedia Education Unit (MEU) in The University of Melbourne work has been focused upon developing generic learning tools which reflect sound educational pedagogies which are easy for non-programmers to use and implement. The interactive graphing tool is one element of a suite of educational tools being developed by the MEU. The remaining sections of the paper discuss the basic functionality of the IGT and the results of a formative evaluation of student usage.
The design of the IGT
IGT and student learning
The interactive graphing tool (IGT) has been designed and used within a framework that links the literature on student learning to that on understanding symbolic representations of chemical phenomena. The IGT is an educational tool which is designed to actively engage students in constructing relationships between macroscopic properties of matter and the symbolic representations used by chemists to represent those processes. While this paper focuses on the formative evaluation of the IGT, the use of such a learning tool must be seen as being incorporated into a computer-aided learning module which is merely part of a variety of curriculum experiences.
In considering the design of any interactive learning tool it is here that the principles underlying constructivism are invaluable. These principles can be summarised as follows :
Any computer-based learning tools we build in order to assist student learning must require students to actively interact with new material in ways which require reflection. It is not sufficient for students to understand an argument or explanation in a detached way. They need to make decisions in their work which show clearly what their own knowledge constructions are. So, choosing between alternatives as in a multiple choice format is not enough; students must build their own representations. This has serious implications for the design of IMM where there has been a heavy reliance on recognition rather than construction in the design of question or problem formats. It is our belief that IMM will only assist student learning when the tasks we design are based on the constructivist principles outlined above. The IGT has the potential to:
In many text books and IMM packages graphs are used widely to explain relationships between variables. In IMM, animations of graphs are often used to explain how relationships vary over time, so that three variables are illustrated. However, students do not build these relationships themselves; they observe the developer's image of them. At best, they may be asked to select between various graphical representations in a multiple choice question.
It has become clear to us that giving students IMM which included a learning tool by which they can build they own images of the relationships between variables and then get feedback from the computer about how useful their images are would be a real advantage in enhancing their learning .
IGT structure
The IGT has been developed in ShockWave® using Macromind Director®. The graphing tool is a ShockWave object which requires a web browser (either Netscape Communicator or Microsoft Explorer) with the appropriate ShockWave plug-in installed. In a Web environment it has the potential to provide students with the opportunity to express the relationships between variables in an active learning environment which provides appropriate feedback, and can be linked to multiple representations (e. g., video images of chemical processes or animations) of chemical concepts.
The algorithm for the development of the graphing object is based upon the mathematics of Bézier curves developed by Pierre Bézier in the 1970s . Bézier curves are used primarily in drawing packages (e.g., Adobe Photoshop®). A simple bézier curve is defined mathematically between two anchor points and the line between these two anchors is interpolated from dragging two control points or 'handles attached to the anchors. All curves drawn by the IGT including logarithmic and exponential shapes are simulated. The range of current default curve styles are shown in Figure 1. Each curve has a default set of values which include:
A wide range of curve shapes can be generated by changing these parameters. In chemistry the range of curves that can be simulated include those used in reaction kinetics, chemical equilibrium, and pH titrations. The current iteration of the IGT will not display or respond to sinusoidal curves or curves which are drawn right to left. The location of the pen tool is shown at the top of the graph and is updated as the student draws the graph. Errors are corrected by using the eraser tool.
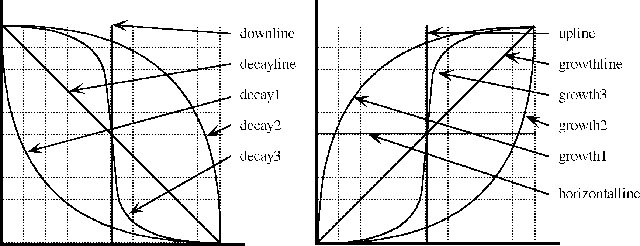
The axis for each graph can be set along with a suitable scale. The tool is able to pre-draw a wide range of curves (Figure 2) also.
Formative evaluation of the interactive graphing tool
Goals of formative evaluation
This study focused on how students used the graphing tool, the difficulties they encountered, and the suggestions they made to improve the tool. The specific goals of the initial formative evaluation focused on student:
The study
The students who took part in the formative evaluation were self selected from first and second year undergraduate science (all names are fictitious). All were experienced users of the first year ChemCAL computer-aided learning package developed at The University of Melbourne. Students were paired and asked to complete four small modules-a tutorial module to gain experience in using the oftware, followed by three modules which investigated kinetics and chemical equilibrium. Students were asked to comment on each of the broad areas listed above as they worked through the modules. The first author was present at each session (to observe, ask questions and assist if the software crashed-it didn't) and all student responses were recorded using audio tape. Written notes were taken during and after each session-which required approximately 35 to 45 minutes per pair.
The modules
The IGT is one component of the Learning Engines project . All of the learning objects being developed as part of the project are designed to communicate (e. g., text input or user interactions) with each other. In Figures 2 and 3 there are two objects on screen. The top one is the IGT and the lower one is a Tutorial Item Set (TIS) object. The IGT facilitates curve sketching graphs on screen using the mouse and the TIS object contains the question scripts and the functionality to respond to input from both students and the course designer. These learning objects facilitate an iterative approach to developing student knowledge constructions between non-graphical and graphical representations of knowledge.
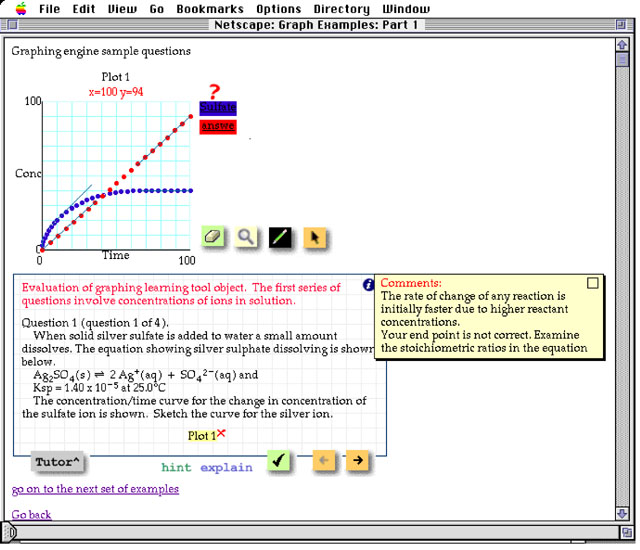
Figure 2: Screen capture of the prototype Interactive Graphing Tool
Figure 2 is a screen capture image of one screen from the second module being used by students. The curved line was pre-drawn by the question script while the straight line is illustrative of a response by a student. The question being asked of students is:
Question 1 (question 1 of 4).
When solid silver sulfate is added to water a small amount dissolves. The equation showing silver sulphate dissolving is shown below.
Ag2SO4(s) ![]() 2 Ag+(aq) + SO42-(aq) and Ksp = 1.40 x 10⁻⁸ at 25.0 oC
2 Ag+(aq) + SO42-(aq) and Ksp = 1.40 x 10⁻⁸ at 25.0 oC
The concentration/time curve for the change in concentration of the sulfate ion is shown. Sketch the curve for the silver ion.
Factors such as; Where does the graph start?, Where does it finish?, What is the shape of the curve?, became immediate problems for students to solve. This is quite unlike selecting from a series of possible answers as in a multiple choice question. The IGT is designed to provide multiple ways of responding to student input. The tutorial item in this example has been scripted to respond to the following components of any curve drawn by a student. They include the:
Student responses
The formative evaluation carried out with students in this instance has indicated that students find this type of task more challenging than conventional multiple choice selection problems. Construction is much harder than recognition. Quotes from student interviews support this statement.
DK How is this different from other experiences of CAL materials of dealing with graphs-materials you have already used?
Anne You have to actively participate. A lot of time with other CAL materials (either static displays of graphs or animations), you watch it, you take maybe 5% of it in. With this you actually have to sit there and work it out... This is much more active.
Mike With the little movies they have in the current CAL labs there's no real insurance that you comprehend what you are seeing.
DK Is this a better way of doing it (learning about graphical representations of knowledge)?
Mike Yes.
Anne Yes.
The navigational issues and general layout of the two learning objects did not result in any problems. However, using the mouse did present problems with at least two of the students. This problem had (to a degree) already been addressed by the designers. The graph sketched on screen by the students was redrawn by the IGT object. In the process of redrawing student input was smoothed by 'snapping' the graph to the grid at 16 pixel intervals. This facilitated the sketching of the graph (the student has to be accurate but not precise) and all students indicated that it was not a serious mechanical difficulty. After practice, all students were able to sketch the desired curve shape.
The feedback mechanism and the visual nature of that are an integral parts of the IGT were seen to be a very positive aspects of the software and this is discussed in the next section.
DK How is this (the IGT) different? This is the kind of question you would find in a book.
Anne You are visualising it instead of just seeing a bunch of numbers in front of you.
Mike Being able to see it (the graph you draw) helps out, rather than just the equation.
At the conclusion of the modules students were asked to their impressions of the IGT as a learning tool. In particular "How is this approach different to that you have seen in multiple choice questions, static displays, or animations of graphical representations of graphical information?". Some of the responses were:
Nick I think its good for students. I'm surprised to say that because it actually makes it harder for them in that they really have to learn (think) about what they know.
Mike This (the approach to graphing using the IGT) makes it into something that is a serious learning tool.
Anne ..also more interesting (than static representations).
and
Mike You have to know what you are talking about with this, you can't go off in a completely wrong direction.
Nick I think it is a good idea to get students involved with the graphing so they can see how their graphing (on-screen sketch) resulted from the (feedback in the comments box) text.
Anne ...if you do have a problem with it (the graph you are trying to sketch) you can't readily go and ask for feedback (with a book or static display).
A number of perceived deficiencies in the current iteration of the software were articulated by the students. These problems included:
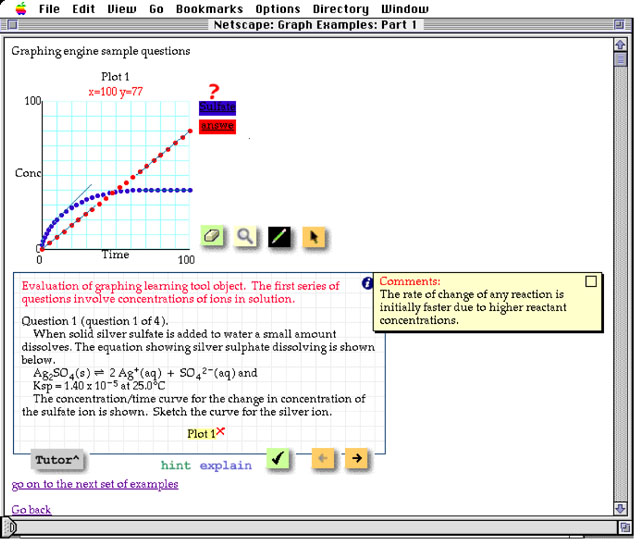
Figure 3: Feedback of the IGT based upon new student input
The authors were well aware of the first problem however it was not possible at the time to have this implemented. It will be part of the next iteration of the IGT. The second and final points have been taken into consideration and will be implemented in the near future. It is envisaged that once a student response has been checked and found to be not correct, that response will fade to 50%, then 25%, of the original while the student has a second or third attempt respectively.
The IGT and Feedback to Student Input
Feedback can be as complete or as minimal as desired by the lecturer. In the current version a lecturer can specify multiple levels of feedback for the student in the TIS object. The TIS object analyses key parameters of the student response provided by the graph object. In Figure 2 the end point is not correct however, the stoichiometric ratio has been incorporated into the representation in Figure 3 which has altered the message in the comments box.
Summary
While the examples provided in this paper relate to reaction kinetics and chemical equilibrium in undergraduate chemistry, it must be stressed that the interactive graphing tool is applicable to many other academic disciplines with similar needs to foster the development of student understanding of graphical representations of knowledge. It is anticipated that the graphing tool will be used the future in other contexts-in subjects that also have a need to link the macroscopic behaviour of objects or materials with graphical representations of knowledge Discussions have been held with lecturers from pharmacology and physics and the requirements of these subjects have been addressed in the current iteration of the IGT. The comments from students in this study were very positive however, further studies are necessary to ascertain any changes to student learning. It is anticipated that a larger scale project will be undertaken in 1998 based upon the input from the pilot study group and the experiences gained in this project. From these data, wider conclusions regarding student learning outcomes and computer-aided learning design issues will be possible.
The expectation is that the number of graph types recognised by the software will be increased as will be the degree of customisation of the graph types recognised by the software. In the future it should be possible for the lecturer to specify the graph set and the graph parameters most applicable to her or his content domain
References
Fritze, P., & McTigue, P. (1997, In this volume). Learning Engines - a framework for the creation of interactive learning components on the Web, What works and why, ASCILITE97. Proceedings of the Australian Society for Computers in Learning in Tertiary Education Conference. Curtin University of Technology, Perth: ASCILITE.
Kennedy, D. M., & McNaught, C. (In Press). Design elements for interactive multimedia. Australian Journal of Educational Technology.
McNaught, C. (1993). Which science? Which language?, Science and Mathematics Education Papers 1993 (pp. 148-171). Hamilton: Centre for Science and Mathematics Education Research: University of Waikato.
McTigue, P. T., Tregloan, P. A., Fritze, P. A., McNaught, C., Hassett, D., & Porter, Q. (1995). Interactive teaching and testing tutorials for first year tertiary chemistry. In H. Maurer (Ed.), ED-MEDIA 1995. Proceedings of the World Conference on Educational Multimedia and Hypermedia. (pp. 466-471). Graz, Austria: Association for the Advancement of Computing in Education.
Plant, D. (1996). What's a Bézier Curve? URL: http://www.moshplant.com/direct-or/bezier/index.html .
(c) David M. Kennedy, Paul Fritze, Peter McTigue
The author(s) assign to ASCILITE and educational and non-profit institutions a non-exclusive licence to use this document for personal use and in courses of instruction provided that the article is used in full and this copyright statement is reproduced. The author(s) also grant a non-exclusive licence to ASCILITE to publish this document in full on the World Wide Web and on CD-ROM and in printed form with the ASCILITE 97 conference papers, and for the documents to be published on mirrors on the World Wide Web. Any other usage is prohibited without the express permission of the authors.

This page maintained by Rod Kevill. (Last updated: Friday, 21 November 1997)
NOTE: The page was created by an automated process from the emailed paper and may vary slightly in formatting and layout from the author's original.