
 |
| [ ASCILITE ]
[ 2004 Proceedings Contents ] |
We report an evaluation study of staff and students in tertiary IT courses delivered via a range of mixed modes. The range covers 100% online, 100% face to face (F2F) onshore and offshore, and both 50% and 75% online offshore. We address service expectations, learning approaches, and satisfaction levels by surveying student and staff priorities (eg. quality academic material, email and assessment turnaround, F2F access to staff).Our evaluation study precedes a marketing initiative targeting education providers onshore and offshore. We aim to inform their choices across the online/F2F delivery spectrum by explaining trade offs (pedagogy, costing, resourcing, etc) from staff/student perspectives.
Based on survey responses, follow-up interviews, and student cohort characteristics, our main findings support: an inverse relationship between availability of a particular service in a mixed mode course and its priority to students; 100% online courses for mature age, working, independent learners, and 50% online (or less) courses for less mature, less independent learners instead of more expensive 100% F2F versions, and a difference in learning styles preferred by 'Asian' and 'African' students, which requires further research if cultural factors are to be included in marketing the most appropriate online/F2F mix.
Now that many of our courses are delivered mixed mode, ranging from 0% online (100% F2F) to 100% online, we need to assess the effectiveness of our range of mixed delivery modes. This contributes to our quality assurance, course planning, course development, and course delivery processes. The true quality of a mixed mode course is not guaranteed simply by ISO certification of (course development) quality but also by course delivery operations (Chiazzese et al, 2004).
Here we report an evaluation study to assess students' perceptions of the effectiveness of our courses delivered by a mixture of modes, ranging from almost 0% online (100% F2F) courses to 100% online courses (as defined in section 3). Beside students, stakeholders in this evaluation study include our teaching staff, course planners and course developers. All need to know which % online version of a course best suits a prospective learning environment, particularly at an offshore campus, possibly under a franchise agreement, and often with limited IT resources. In addition to educational effectiveness, course planners also consider cost effectiveness. Indeed, other stakeholders in this evaluation study include higher management who need to market the most appropriate mix of F2F (on campus) and online (on or off campus) for prospective client educational institutions, commercial enterprises and government agencies.
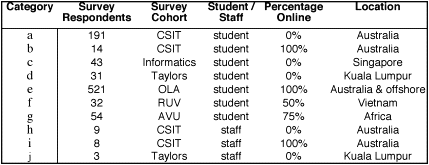
Our evaluation study attempts to measure students' service expectations, learning approaches, and degrees of satisfaction in our IT courses, as delivered via a range of mixed modes (from 0% online to 100% online). Our study covers the following student cohorts in IT degree programs; an additional AVU cohort comprised diploma students:
At the end of each course delivered via (a) to (f), students and staff are asked to complete a course priority survey (Zuluaga, 2003a) - see Figure 1 in section 2. This survey asks that services provided during each course (eg. quality of academic material, email and assessment turnaround times, F2F access to staff) be ranked in order of importance. It is important to note that although the survey targets a particular course, the same course is generally available to each of the above cohorts (a) to (g)). When we analyse survey responses across (a) to (g) in section 3, we are comparing responses across the modes of delivery for essentially the same course. Those students who completed more than one course by the same mode at the one time were instructed to complete one survey that 'averaged' their responses across these courses as delivered via that mode. Our earlier research (Morris, Zuluaga, 2003) found that students tended to average their responses across courses anyway, even when it was emphasised that we wanted to compare their responses between courses (delivered via the one mode).
The aim of the survey is then to provide an insight into students' perceptions of what is most important to them in a course, as delivered via a particular mode (Pannan, McGovern, 2003). Staff are also asked to rank the same services in the order they consider most important to students doing a course via a particular mode. Our study covers the following staff cohorts :
Our evaluation study is both summative, as it reflects on courses after delivery is completed, and formative, as it informs iterative course planning, development and delivery processes from the mode of delivery perspective (Phillips, 2003).
In section 2 we explain the design of our evaluation study. In section 3 we present the statistical analysis and our findings. Section 4 discusses issues raised by the findings, and we present our conclusions in section 5.
As our major evaluation tool we chose a ranking survey - a method not discussed in the otherwise comprehensive 'Evaluation Cookbook' (Hervey, 1998). Our reasons for using a ranking survey follow :
Our course priority survey (Zuluaga, 2003a) lists 15 services or aspects of flexible learning, as shown in Figure 1 below. A definition of each service is included (Zuluaga, 2004). For example, 'interactive quizzes' include tests delivered online via WebLearn (Fernandez, 2001) - a standalone assessment tool developed at RMIT, or similar quiz facilities in WebCT and Blackboard. 'FAQs' comprise a "question bank of past queries provided to students for reference prior to posting queries or emailing staff for support". 'ICQ' refers to "synchronous chat sessions mostly between students with occasional feedback from staff. Informal and optional".
The survey instructions (Zuluaga, 2003b) ask that these services be ranked from highest priority (1) to lowest priority (15). No two services are to be given the same priority. The ordering of the services in the survey is alphabetical, as noted in the instructions. It is nevertheless impossible to rule out that the ordering influenced their ranking by respondents, as noted in our findings at the end of section 3.2.
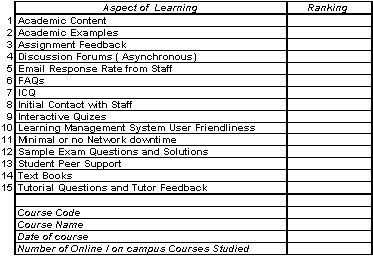
Figure 1: Course priority survey
We obtained the numbers of completed surveys from each of the staff and student cohorts shown in Table 1 below :
We calculated Pearson's Correlation Coefficient, r, for each cohort pair, assuming both variables (eg. (a) and (b)) are interval/ratio and approximately normally distributed, and their joint distribution is bivariate normal. r is a measure of the strength of the association between variables. r can vary from -1.0 to 1.0, where -1.0 is perfect negative (inverse) correlation, 0.0 is no correlation, and 1.0 is a perfect positive correlation. The t-test is used to establish if r is significantly different from zero, and, hence there is evidence of an association between variables (Campbell, Machin, 1999).
An absolute r value over 0.80 is considered a strong correlation, provided the associated t-test value is significantly low. A significance of 0.05 or 0.01 equates to 95% or 99% confidence level respectively. Correlation is a measure of association, not causation. No causal inference should be drawn from either strong or weak correlation. The ability to assign cause and effect depends on the creation of an experiment specifically designed to provide this kind of inference. We used follow-up interviews and investigation of cohort characteristics for this purpose.
Before comparing cohorts experiencing different degrees of online course delivery, we firstly define '% online' more accurately. For our purposes, 'online' and 'F2F' are at opposite ends of a single spectrum :
For example, 75% online = 25% F2F. Each percentage refers to the amount of the total course material delivered to students via that mode. Where material is delivered by one mode primarily, and the other mode secondarily, we only count the primary mode of delivery. For example, if online material is also the basis for a F2F tutorial, we only count the material in the % online.
There is a strong positive correlation (0.865, sig. = 0.000) between the RUV and Informatics students' priorities (cohorts f and c). Interestingly, these 'Asian' cohorts, compared with the above 'African' cohort (g), have quite different priorities. We believe there is some evidence that this difference could be in part attributed to a culturally based difference in preferred learning styles. We discuss this further in sections 3.2 and 4.
There is also a strong positive correlation (0.824, sig. = 0.000) between the Informatics students' and OLA students' priorities (cohorts c and e). Both cohorts have a similar profile in that they tend to be mature age, independent learners, especially compared with the other cohorts in our study. Both cohorts include more full time workers than other cohorts, particularly workers in the IT industry. We assert their priorities are indicative of this profile, regardless of whether the students are on-campus in 100% F2F courses (Informatics) or in 100% online courses (OLA). This tentative conclusion was tested in follow-up interviews - see section 4.2.
There is a strong positive correlation (0.874, sig. = 0.000) between priority responses from RMIT on-campus staff and online OLA students (cohorts h and e). RMIT on-campus staff responses also have a strong positive correlation (0.809, sig. = 0.000) with the priorities of RMIT on-campus students (a). The latter correlation is expected, but the former correlation could suggest that the surveyed RMIT online staff are less in touch with their online students. We must however point out that all RMIT online staff are also on-campus staff, whereas relatively few RMIT on-campus staff are also online staff. We suspect survey responses from staff that teach both online and F2F (on-campus) may be confused. To test this concern, we discuss in section 4.2 interviews with staff that teach both online and on-campus at RMIT.
RMIT on-campus students have a medium to high positive correlation (0.798, sig. = 0.000) with the priorities of OLA students. We think this can be accounted for by similarities in their profiles. In particular, both cohorts (a and e) have fundamentally the same objectives - improve their education / get a degree, and hence improve their career prospects / get a higher salary / status. Admittedly, there are more mature age students in the OLA cohort. But perhaps more importantly, the previous academic achievements of the OLA cohort are on average less than for the mostly recent secondary school graduates in the RMIT on-campus cohort (Morris, Zuluaga, 2003). It may also be worth noting that both cohorts (a and e) are mostly 'Australian' domicile students, which could account for similar expectations of their chosen courses, whether on-campus (F2F) or online.
Interestingly, the only medium to high positive correlation (0.785, sig. = 0.001) for the Taylors students (Kuala Lumpur, cohort d) is with the Informatics students (Singapore, cohort c). This could be attributed to an 'Asian' preferred learning style (mentioned above), if one exists. Or it may be explained by similarities in the profiles of both cohorts (mature age, independent learners), although the Taylors cohort (d) has more students outside this profile. We discuss further investigation of this result in section 4.2.
Finally, there is a very strong correlation (0.935, sig. = 0.000) between Taylors staff (cohort j) priorities and those of RMIT on-campus staff (cohort h), and again (0.937, sig. = 0.000) with those of RMIT online staff (cohort i). This is to be expected, and provides an internal consistency check to raise confidence in the results of our evaluation study.
For completeness, we list the following medium positive correlations.
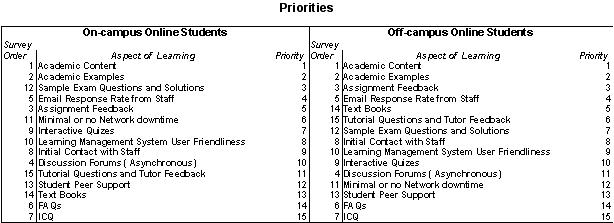
Figure 2: On-campus online versus off-campus online
A donkey vote may discount the top 2 on-campus and 3 off-campus items (Academic Content, Academic Examples). Nevertheless, a high standard of academic content is a given for the learning materials we develop for all on-campus / online / mixed-mode cohorts.
'Email response Rate from Staff' and 'assignment feedback' are clearly the next highest priority for both off-campus (e) and on-campus (b) surveyed students. This has been the main priority of RMIT online staff from the outset, and it is gratifying to see evidence from students in support of this initiative and policy.
The remaining priorities differ between the on-campus (b) and off-campus (e) surveyed students. On-campus surveys rate the learning management system (LMS) and its features most important. Off-campus surveys rate the text book and sample exam most important.
We conjecture that:
AVU degree and diploma
The 54 strong AVU cohort (g) included 8 students enrolled in the diploma instead of the degree. Without attributing statistical confidence to the relatively small AVU diploma cohort (g subset), we compare their averaged responses (Figure 3 below).
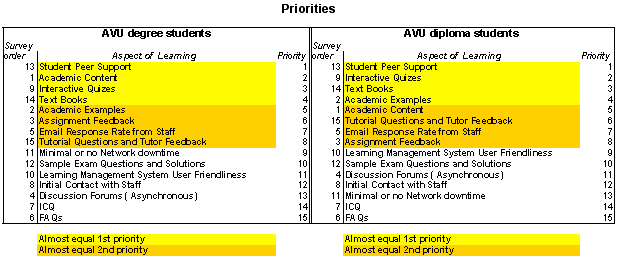
Figure 3: AVU degree versus diploma
A donkey vote may discount Academic Content and Academic Examples in the top 2 tiers. The AVU cohort responds more like the off-campus online cohort (e), for instance in rating the importance of 'Text Books' highly. However, the availability of text books is more likely an issue for AVU students than for most off-campus online students.
Interestingly, 'Student Peer Support' is top priority, whereas both on-campus (RMIT) and off-campus (OLA) cohorts (b and e) rate it very low. Anecdotal evidence from AVU students we personally met prior to startup of the RMIT computer science program indicated they lacked confidence in their teachers (Zuluaga, Morris, 2003). So the support of fellow students may still be seen by the AVU cohort (g) as a last resort - a conjecture we also attribute to some RMIT on-campus students. Alternatively, the importance of student peer support may be attributable to an 'African' preferred learning style, if one exists (see section 4.1).
RMIT on-campus staff and RMIT online staff
Without attributing statistical confidence to the relatively low numbers of RMIT on-campus staff (cohort h) and online staff (cohort i) surveys, we compare their averaged responses (Figure 4 below).
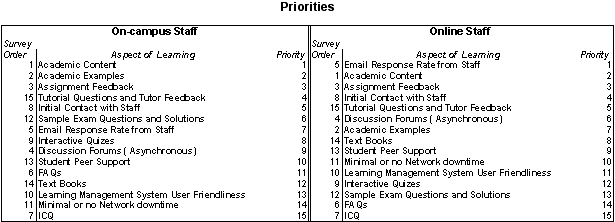
Figure 4: RMIT on-campus versus online staff
A donkey vote may discount the top 3 on-campus items (Academic Content, Academic Examples, Assignment Feedback). However, a high standard of academic content is a given for the learning materials we develop for all on-campus / online / mixed mode cohorts, so online staff may have taken the priority of these items more for granted. Nevertheless, 'Email Response Rate from Staff' is clearly the top priority of RMIT online staff, as stated above.
'Tutorial Questions and Tutor Feedback' and 'Initial Contact with Staff' are clearly the next highest priority for both RMIT on-campus (h) and online (i) surveyed staff. Of course the context is quite different for these two items on-campus and online. For RMIT online staff (i), we interpret the 'Email Response ..' item as the vehicle for demonstrating their 4th and 5th ranked priorities.
The remaining priorities for both RMIT on-campus (h) and online (i) surveyed staff are similar, with the exception of 'Sample Exam Questions and Solutions'. Clearly RMIT on-campus surveyed staff (h) rate this item significantly higher than do RMIT online staff (i). If we factor in the higher priority given by RMIT on-campus staff (h) to 'Academic Examples', there is an on-campus emphasis on examples that is not apparent online. Why? The answer from our interviewed staff is that on-campus tutorials cannot focus on the current assignment beyond generalities. A particular student's partial attempt can rarely be discussed in class. Instead a related example is dissected. If the online equivalent of a tutorial, albeit personalised, is an email interaction with one student, their partial attempt at the current assignment can be dissected in detail. We have discussed the educational effectiveness of these two approaches elsewhere (Morris, Zuluaga, 2003).
Finally, it is not surprising to see 'Academic Content' and 'Academic Examples' rank so highly with all students and staff. These two aspects of learning / services are listed 1st and 2nd respectively on the survey form, so there is the possibility of a donkey vote. Further, there is the possibility of perceived bias in the authors' listing these two services 1st and 2nd, despite the ordering being purely alphabetical, as noted in the survey instructions. Hence, it is impossible to rule out that the ordering influences their ranking.
Nevertheless, some experts on Africana argue there is a unique African culture, even way of thinking. They highlight a strong oral tradition (story telling), rich mythology, partly from superstition, even animism, and above all a powerful belief in communalism. They also allude to a preferred African learning style, for example "…African scholars' prescriptions for Africa's future focus on economic independence through educational processes that combine Western techno-economic theory and practice with the best of African sociocultural traditions" (Lassiter, 1999). Further to the point (Konadu, 2004) "Africana studies … should develop leadership competence in community and culture. Such a process and institution may have associations with non-African learning structures, but should be relatively self-sufficient and located in physical and psychic spaces that Africans identify and defend as theirs".
Following on from section 3.2, we conjecture that the preferred learning style in an African culture is communal, collaborative, requiring each individual to participate in a collective effort, akin to osmosis. This could explain the importance of student peer support to the AVU cohort (g), at least in part. Further, any lack of confidence in themselves or their teachers, as mentioned in section 3.2, could be expected to increase the importance of peer support.
The AVU cohort (g) and its diploma subset ranked 'Interactive Quizzes' as respectively 2nd and 3rd priority. No other cohort ranked this aspect higher than 7th, so we assert this result is significant too. We conjecture that a lack of confidence can explain this result too, at least in part. The novelty factor of computerised interactive quizzes is also stronger for the AVU cohort (g) than for the others, where such quizzes have become familiar.
Online OLA students
A result the reader might not expect is that RMIT on-campus students (cohort a) ranked 'Network Downtime' as more important (6th) than the online (OLA) students (cohort e) did (12th). We think the explanation is that RMIT on-campus students (a) frequently complain about delays in getting their accounts and passwords to access the RMIT learning management system (LMS). Administrative processing via RMIT's academic management system (AMS) is the heart of the problem, and is being remedied. In the meantime we believe on-campus students (a) pick 'Network Downtime' in the survey as the closest 'service' for their frustrations. In contrast, online (OLA) students (e) mostly access a different LMS, which is dedicated to them. Their enrolment and other administration also bypasses the AMS.
Online (OLA) students (e) ranked 'Text Books' as far more important (5th) than RMIT on-campus students did (13th). This is to be expected when the F2F experience on campus is not available to these online students. Interestingly, on-campus mixed mode (50% online) RUV students (cohort f) ranked 'Text Books' as top priority (1st). Text books are relatively more expensive in Vietnam than in many countries. And they are less readily available. Photocopies in breach of copyright are commonplace. The RUV ranking of this 'service' is indicative of this situation.
Online (OLA) students (e) ranked 'sample exam questions and solutions' as less important (7th) than 'Text Books' (5th). RMIT on-campus students (cohort a) ranked 'Sample Exam Questions and Solutions' far higher (3rd), and well above 'Text Books' (14th). Our previous research on the educational effectiveness of 100% online IT courses (Morris, Zuluaga, 2003) found that responsiveness of online tutors to queries emailed by online students was highly regarded. We think this explains the lower need by online students (cohort e) for 'Sample Exam Questions and Solutions'. This service is effectively supplied by 4 hour average email turnaround, 24/7, which often means 15 minute turnaround during RMIT business hours. Our previous research also reported that some RMIT on-campus students with experience of 100% online courses would prefer this type of online email service instead of a tutorial once a week. These tutorials cannot answer all sample exam questions that each individual student in the tutorial may want. This could explain why RMIT on-campus students (a) ranked this service 3rd top priority.
The 'Email Response Rate From Staff' service is ranked less important by Informatics (cohort c) and RUV (cohort f) students (12th, 11th) than by AVU (cohort g) students (7th). We note that the Informatics and RUV students have more F2F contact with staff than the AVU students do. The same service is ranked more important to RMIT on-campus students (cohort a) and online (OLA) students (cohort e) than to the AVU students. Certainly the AVU students have more F2F contact with staff than the online (OLA) students do. But RMIT on-campus students have more F2F contact again. However, RMIT on-campus students appear to believe that they have insufficient staff contact, and some of these students prefer email to tutorials, as noted above. So our evidence indicates that the importance to students of the 'email response rate from staff' service is inversely proportional to the amount of F2F contact with staff. RMIT online staff (cohort i) ranked this service as top priority (1st), far higher than any other cohort. We think this is explained by their pride in delivering a responsive service, 24/7, as noted above.
In section 3.1 we also noted a strong correlation between RMIT on-campus staff (cohort h), OLA students (cohort e) and RMIT on-campus students (cohort a). The latter correlation is expected, but the former could suggest that the surveyed RMIT online staff (cohort i)are less in touch with their students. However we pointed out that all RMIT online staff are also on-campus staff, whereas relatively few RMIT on-campus staff are also online staff. We thought survey responses from staff that teach both online and F2F (on-campus) may be confused. To test this, we interviewed three (3) staff who teach both online and on-campus at RMIT. Each staff member submitted two surveys, one from their online perspective and the other from their on-campus perspective. On further questioning, it was confirmed that the latter perspective had been 'coloured' by their online teaching experience. The strong correlation between RMIT on-campus staff and OLA students (cohorts h and e) should therefore be discounted.
We reported at the end of section 3.1 that the only correlation for the Taylors (cohort d) students (Kuala Lumpur) is with the Informatics (cohort c) students (Singapore). We conjectured this could be due to either an 'Asian' preferred learning style or similarities in the profiles of both cohorts. We were not able to directly interview Kuala Lumpur students. So to investigate further we emailed the three (3) Taylors staff who earlier completed surveys. We asked how well their students fitted the Informatics student profile. Responses confirmed that a significant number of Taylors students do not fit the Informatics profile. Further research is needed into the possibility of an 'Asian' preferred learning style, or even to collect evidence of a learning style shared by Taylors and Informatics.
An overview of the priority ranking of services (aspects of learning) by the various cohorts above can be seen in many cases to be inversely proportional to the availability of a service. For example, if 'Text Books' are unavailable, this service is ranked highly. If 'Text Books' are readily available, this service is ranked much lower. This can be used to market the appropriate mix of online (off-campus) / F2F (on-campus) to a potential client educational institution, based on the availability of their services and resources.
The strong correlation between the priorities of the Informatics and OLA cohorts (c and e) in section 3.1 suggests to us that almost 100% F2F (on-campus) courses (eg. Informatics) and 100% online (off-campus) courses (eg. OLA) can equally suit mature age, working, independent learners. This supports marketing less expensive online courses as equally meeting the evident needs of this student profile.
A more tenuous conclusion, based on the strong correlation in section 3.1 between the priorities of Informatics and RUV cohorts (c and f)), is that less mature, less independent learners can equally be catered for by 50% online (on-campus) courses (eg. RUV) instead of more expensive 100% F2F (on-campus) courses (eg. Informatics). We note no such correlation between Informatics and AVU cohorts (c and g), so we would not support increasing online delivery to 75% (as for AVU) for less mature, less independent learners.
In sections 4.1 and 4.2 we discussed evidence raised in section 3.1 of different preferred learning styles for 'Asian' and 'African' student cohorts. The possibility that this difference is culturally based deserves further research. If further support eventuates, cultural considerations can be factored into the marketing of the most appropriate mix of online (off-campus) / F2F (on-campus) for a potential client educational institution.
Chiazzese, G., et al. (2004). A quality procedure to perform distance learning processes. Italian National Research Council Institute for Education Technology. eLearnInternational 2004 [1 Aug 2004, verified 23 Oct 2004] http://www.elearninternational.co.uk/2004/test/2004/refereed_papers.asp
Fernandez, G. (2001). WebLearn: A CGI-based environment for interactive learning. Journal of Interactive Learning Research, 12(2/3), 265-280.
Hervey, J. (Ed) (1998). Evaluation Cookbook. Learning Technology Dissemination Initiative, Heriot-Watt University. [1 Aug 2004, verified 23 Oct 2004] http://www.icbl.hw.ac.uk/ltdi
Konadu, K. (2004). The cultural identity of Africa and the global tasks of Africana studies. African Studies Quarterly, 7(4). [1 Aug 2004, verified 23 Oct 2004] http://web.africa.ufl.edu/asq/v7/v7i4a3.htm
Lassiter, J. (1999). African culture and personality: Bad social science, effective social activism, or a call to reinvent ethnology? African Studies Quarterly 3(2). [1 Aug 2004, verified 23 Oct 2004] http://web.africa.ufl.edu/asq/v3/v3i3a1.htm
Lynch, K. (2004). Private communication.
Marama, D. (2004). Private communication.
Morris, E.J.S. & Zuluaga, C.P. (2003). Educational effectiveness of 100% online I.T. courses. In Interact: Integrate: Impact: Proceedings 20th ASCILITE Conference, pp. 353-363. Adelaide: Adelaide University. http://www.ascilite.org.au/conferences/adelaide03/docs/pdf/353.pdf
Pannan, L. & McGovern, J. (2003). Mainstreaming online delivery: staff experience and perceptions. In Interact, Integrate, Impact: Proceedings 20th ASCILITE Conference, pp. 396-406. Adelaide: Adelaide University. http://www.ascilite.org.au/conferences/adelaide03/docs/pdf/396.pdf
Phillips, R. A. (Ed) (2000). Handbook for Learning-centred Evaluation of Computer-facilitated Learning Projects in Higher Education. Murdoch University. http://www.tlc.murdoch.edu.au/archive/cutsd99/handbook/handbook.html
Phillips, R. & Lowe, K. (2003). Issues associated with the equivalence of traditional and online assessment. In Interact, Integrate, Impact: Proceedings 20th ASCILITE Conference, pp. 419-431. Adelaide: Adelaide University. http://www.ascilite.org.au/conferences/adelaide03/docs/pdf/419.pdf
Reeves, T. & Harmon, S. (1993). User Interface Rating Form. [1 Aug 2004] http://mime1.marc.gatech.edu/MM_Tools/UIRF.html
SPSS (1999). Statistical Services SPSS Software. University of Texas at Austin. http://www.utexas.edu/cc/stat/software/spss/
Zuluaga, C.P. (2003a). RMIT CS&IT Course Priorities Survey. [1st August 2004] http://serfola.cs.rmit.edu.au/OLA/Courses/CPT11/OnlineSurveyTable.pdf
Zuluaga, C.P. (2003b). RMIT CS&IT Course Priorities Survey Instructions. [1st August 2004] http://serfola.cs.rmit.edu.au/OLA/Courses/CPT11/OnlineSurveyStudentInst.pdf
Zuluaga, C.P. (2004). RMIT CS&IT Course Priorities Survey Definitions. [1st August 2004] http://serfola.cs.rmit.edu.au/OLA/Courses/CPT11/OnlineSurveyPrioritiesDefinitions.pdf
Zuluaga, C.P., Fernandez, G. (2003). RMIT CS&IT Students Survey Form-CS116 Information Technology 1. [30 Jul 2004, verified 23 Oct 2004] http://weblearn.rmit.edu.au/cgi-bin/surveys/display_survey.cgi?id=cs116Eval-1-2003.htm
Zuluaga, C.P. & Morris, E.J.S. (2003). A learning management model for mixed mode delivery using multiple channels (Internet, intranet, CD-ROM, satellite TV). In Interact, Integrate, Impact: Proceedings 20th ASCILITE Conference, pp. 562-568. Adelaide: Adelaide University. http://www.ascilite.org.au/conferences/adelaide03/docs/pdf/562.pdf
Zuluaga, C.P., Morris, E.J.S. & Fernandez, G. (2002). Cost-effective development and delivery of 100% online I.T. Courses. In A. Williamson, C. Gunn, A. Young and T. Clear (Eds), Winds of Change in the Sea of Learning: Proceedings 19th ASCILITE Conference, pp. 759-766. Auckland: UNITEC Institute of Technology. http://www.ascilite.org.au/conferences/auckland02/proceedings/papers/109.pdf
| Authors: Ed Morris, Catherine Zuluaga, School of Computer Science and Information Technology, RMIT University. ted@cs.rmit.edu.au, cz@cs.rmit.edu.au Liz Atkinson, Director, blue group marketing, liz@bluegroupmarketing.com Please cite as: Morris, E., Zuluaga, C. & Atkinson, L. (2004). An evaluation of it courses delivered via a range of mixed modes. In R. Atkinson, C. McBeath, D. Jonas-Dwyer & R. Phillips (Eds), Beyond the comfort zone: Proceedings of the 21st ASCILITE Conference (pp. 677-687). Perth, 5-8 December. http://www.ascilite.org.au/conferences/perth04/procs/morris.html |
© 2004 Ed Morris, Catherine Zuluaga & Liz Atkinson
The authors assign to ASCILITE and educational non-profit institutions a non-exclusive licence to use this document for personal use and in courses of instruction provided that the article is used in full and this copyright statement is reproduced. The authors also grant a non-exclusive licence to ASCILITE to publish this document on the ASCILITE web site (including any mirror or archival sites that may be developed) and in printed form within the ASCILITE 2004 Conference Proceedings. Any other usage is prohibited without the express permission of the authors.